news
USA TODAY
Michigan woman charged in boat club crash that killed 2 children released on bond
CNN
Indian voters battle extreme temperatures as intense heat wave hits region
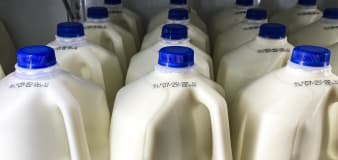
NBC Universal
1 in 5 samples of pasteurized milk had bird flu virus fragments, FDA says
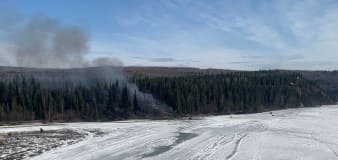
USA TODAY
Pilot on Alaska fuel delivery flight tried to return to airport before fatal crash: NTSB
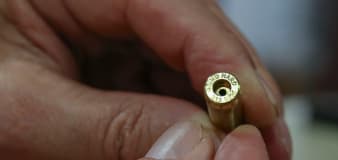
USA TODAY
American found with ammo in luggage on Turks and Caicos faces 12 years: 'Boneheaded mistake'
Advertisement


Stay informed and up-to-date with your local news, breaking news events, global events, savings events, solar eclipse news, and in-depth coverage on a wide range of topics. From politics and technology to entertainment and science, we bring you the latest news from around the world.


