news
Associated Press
Man shot 13 times in Chicago traffic stop where officers fired nearly 100 rounds, autopsy shows
NBC Universal
US and 17 other countries demand that Hamas release hostages held in Gaza
Associated Press
Mexican president claims that criminal groups are 'respectful' and 'respect the citizenry'
Associated Press
Harvey Weinstein’s rape conviction is overturned by New York's top court
USA TODAY
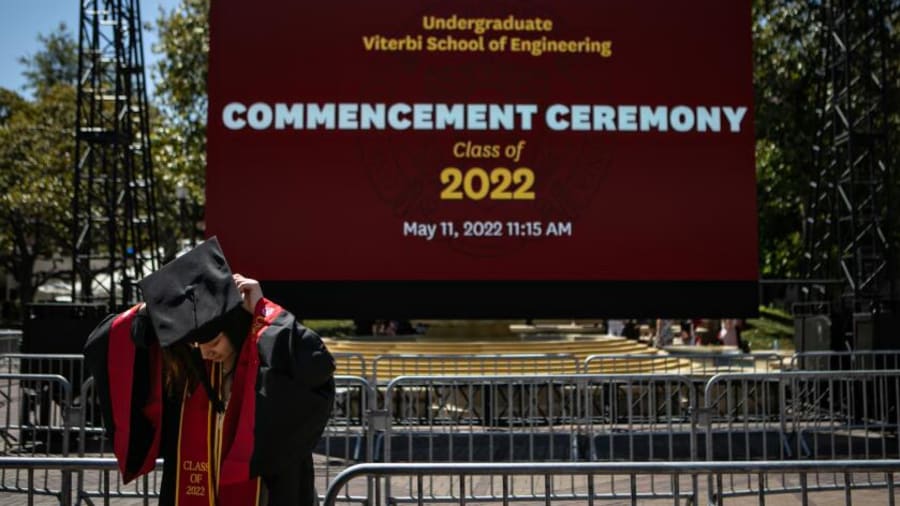
Columbia faces protest deadline; USC cancels main graduation ceremony: Live updates
Advertisement


Stay informed and up-to-date with your local news, breaking news events, global events, savings events, solar eclipse news, and in-depth coverage on a wide range of topics. From politics and technology to entertainment and science, we bring you the latest news from around the world.


